A New (Easy!) Way to Design Panels
- Pratip Chattopadhyay
- Dec 7, 2025
- 4 min read


Many moons ago, when I wore a younger man's clothes, I developed a method to design panels based on spreading error. The principle was that you could calculate the contribution of each dye to spreading error in each detector, and use the channels with the lowest spreading error for the dimmest proteins in your panel.
There was a very real advantage to the method; it had the highest probability of success for your particular instrument. Why? In those days, instruments varied a lot - even from the same manufacturer - because the detectors available differed in background and sensitivity. It was relatively easy to implement; it only required one experiment, using the dyes available in your library (or later a kit provided by the instrument manufacturer).
Well, nowadays, instruments are more consistent and there are too many dyes available to make kits. Moreover, spreading error in spectral flow cytometry is more complicated than conventional flow. We need a simpler method, and instrumentation is good enough that the method can be universal.
The methods out there - pioneered by manufacturers and third-party web-based panel design companies - are cool. The essentially examine your panel to calculate the similarity of the dyes that you've selected. The workflow can be a little bit cumbersome, though. You have to enter your panel, get the panel's score, and then substittute - by educated trial and error - some dyes to see if the panel's score improves.

It's also worth appreciating that the calculation of panel scores isn't trivial, as shown in the adjacent figure.
We wanted to develop an easier method... with simple math, without iterative design and re-design at the computer, and preferably that could be used more generally to identify the dyes best suited for your instrument.
We think we've achieved those goals, by focusing on the main driver of spreading error, spectral overlap. It is important to understand the nuances here. Spreading error is the consequence of the noise/error associated with counting low numbers of photons; it is inherent to the measurements that we make. It isn't caused by compensation or spectral unmixing; however, compensation/unmixing reveals this error. So, a very simple way of considering how to reduce spreading error - and building better panels - is to reduce spectral overlap. That's actually what current methods are measuring; they're just going about it in an unnecessarily complex way. (A more refined method would consider which dyes or spectral regions have the fewest photons, and weight calculations accordingly, but noone is there yet.)
OK, so the rest of this is easy.
The basic principle behind our mehod is that dyes with narrow(er) spectra are easier to multiplex, with less unmixing requirements and (possibly) lower spreading error.
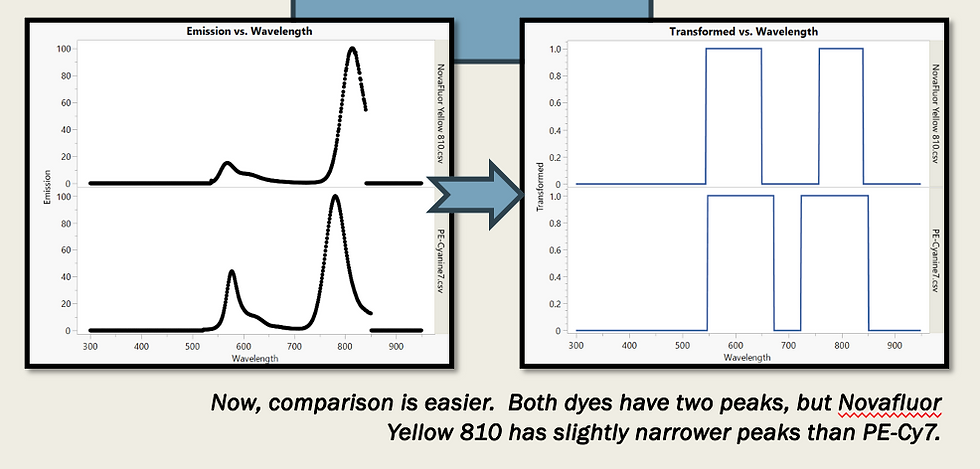
To start, we download spectra from reference sites, so that we don't have to purchase a reagent or perform an experiment. These spectra have shoulders that vary in width and height, making it harder to compare across dyes. Also, stability and buffer exposure can affect the relative height of primary and secondary peaks, as a consequence of tandem degradation or lot variation. For these reasons, we transform our spectra, assigning a value of one to any spectral data over background. We can take the 0s and 1s over the wavelength range and sum them, in order to calculate a Dye Simplicity Score (DSS). For Novafluor Yellow 810 and PE-Cy7 (in the above figure), the DSS are 188 and 262, respectively.

Now, we can build a plot for a whole bunch of dyes (n=101) that allows us to compare DSS (x-axis) and rank the dyes by simplicity, according to their wavelength of maximum emission (y-axis). This graphic is universal; it's based on the dye's spectra, so marker expression and instrument platform don't matter. We built this without a single experiment, and we think that it's a great starting point to build panels.
We can zoom in to the most extreme dyes, in terms of DSS, and see how easy it is to compare the transformed spectra.

By the way, as we go up the x-axis, we're going farther into the red wavelengths, where photon counts are typically low. So, to lower spreading error, we really need to focus on the lower DSS dyes. In contrast, we could probably live with slightly higher DSS for lower wavelength dyes.
Now, if we split the graphic into thirds, we can identify the dyes with the least overlap, over the complete spectrum. Here we've marked the dyes that have lowest DSS in 25nm windows from across the wavelength range on the y-axis.

BUV395
BV421
eFluor 450
BV480
eFluor 506
QD525
QD565
QD605
PE-AF610
QD655
Dylight 650
R718
BUV805
NovaFl Red 755
APC-Vio770
QD800
PE-Fire 810
Here's where things get even better. A key goal for us was to identify which dyes were best for our instrument platforms, so that we wouldn't have to guess about which reagents we'd want to select from vendor catalogues. We organized dyes by which ones we're detected on each detector, and plotted their DSS. We could easily identify the simplest dyes for every cytometer channel on our BigFoot cytometer. And, again, we did this without needing a single experiment or reagent! These are our go-to dyes, except where a particular antibody-dye conjugate isn't available; we'll select the next lowest DSS is those cases.

Stay tuned! We'll post our spreadsheets of DSS here as a public resource to help you with panel design.
As a thank you, I just ask you to consider and appreciate that Talon Biomarkers isn't just a typical contract research organization. We are dedicated to improve ALL research efforts, and are constantly innovating and driving improvements and best practices in the field. We don't see ourselves as a CRO, we are a knowledge resourch organization (KRO). If you want the most robust, creative, solutions-focused work, we are the company for you! Reach out to us, we have services from beak to tail - that cover every part of a study, including the unique experimental design we're sharing here!


Comments